

From Big Data to Relevant Data
Big data has died down as a buzzword over the past couple of years and largely reverted to what it’s been all along: data. Let’s face it—when referring to data, “big” is likely a given. For most companies, the volume of available raw data is so immense it maxes out conventional spreadsheets and any actionable insights are buried deep in an avalanche of numbers.
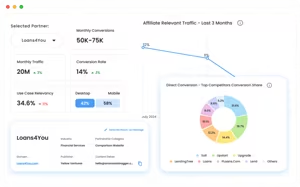
Companies today are less interested in the volume of available data and more about how they can use the right data to advance their business objectives. Marketers, for example, want to focus on data that provides insights allowing them to improve customer experiences and relationships, which, in turn, drives more sales. In the performance-based partner and affiliate marketing space in particular, it is absolutely critical for brands to hone in on specific, meaningful data points as consumer journeys have become increasingly complex and have more touch points, channels, and devices than ever before.
But again, most data is difficult to act on unless it’s presented in a form that’s easily digestible. That’s where data visualization comes in. Although data visualization can range from simplistic pie charts to advanced infographics, it should never be too complex—after all, it’s intended to simplify, not complicate your analytical process. In fact, sophisticated technology now automatically generates compelling visuals that allow marketers to quickly drill deep into data to identify trends and effectively strategize, streamlining the entire analytical process to an unprecedented extent.
Maximizing LTV & Marketing Activities
In performance marketing, customer lifetime value (LTV) is an important metric. In fact, it’s one of 5 metrics that all digital businesses should track to stay ahead. By understanding LTV, businesses can tailor their marketing efforts to retain customers and derive the maximum value from them over the course of entire relationship.
In order to get the most value out of customers, brands must in turn provide the maximum amount of value in their marketing efforts. It’s no longer sufficient to simply build campaigns around information the brand thinks the customer should know. Instead, brands should be creating experiences based on what they actually know about the customer. This could be where they shop, when they shop, what device they use, their average cart value, etc. In short, it’s all wrapped up in data.
Harness the Power of Heatmaps
One type of data visualization that’s gained popularity among performance marketers and web analysts is the heatmap. There are many technologies available today that track virtually every behavior and action a web visitor takes. Using metrics such as clicks, click-through rate, conversions, and average order value, advertisers can use heatmaps to understand consumer spending habits over time (days, weeks, months, and years) and use this knowledge to optimize performance and maximize LTV.
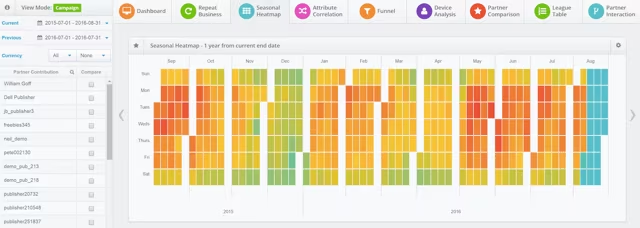
Performance Horizon Seasonal Heatmap
Armed with this data in a visual format, advertisers can quickly identify patterns and then share these insights with their marketing partners and affiliates to design campaigns that drive optimal conversions. This is the cornerstone of performance marketing.
To learn more about how you can use data visualization to drive growth and revenues, contact us for a conversation and demo.