
Now, more than ever, marketers need data to serve as their guide. In response to this, Partnerize is excited to announce the launch of The Partnership Growth Index™, a comprehensive report examining key trends across the APAC region. The Partnership Growth Index represents the continued and global evolution of the Affiliate Marketing Sales Index previously introduced as the first index for the category under the acquired Pepperjam brand. As a hub of digital commerce, Partnerize is in the unique position to deliver insights that will help global brands, partners, and the broader industry navigate through times of uncertainty and beyond. These periodic indices serve to assist marketers as they confront both near-term and long-term challenges and will give them the tools they need to foster profitable growth.
For our first Partnership Growth Index™, we wanted to share some of the key insights from the APAC data over November 2020 – February 2021, and what that means for marketers.
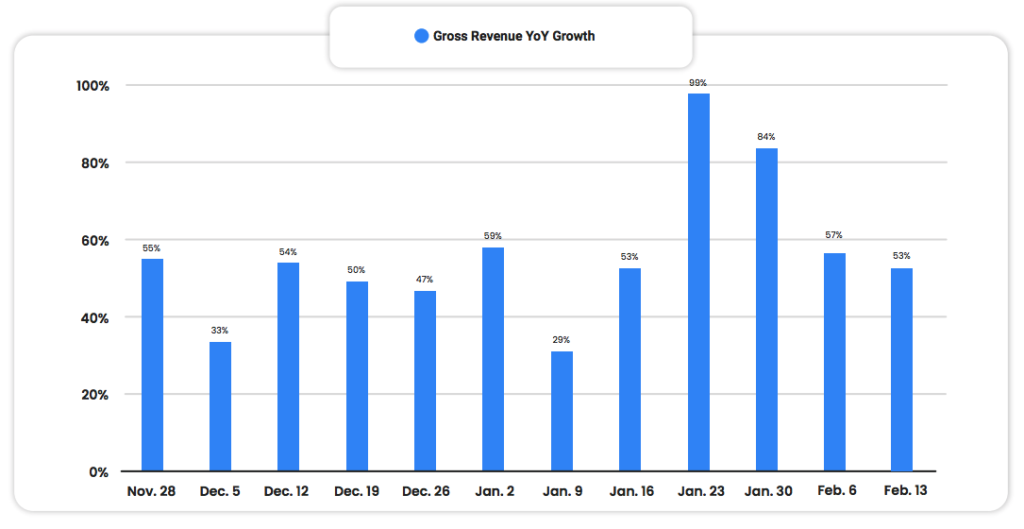
Revenue Growth Is Strong
The data showed that over the trailing six weeks, revenue from the channel increased by 65% YoY. This is a huge increase – some weeks it was nearly 100% YoY growth – and is certainly indicative not only of increased ecommerce activity, but also heightened use of the partnership channel by marketers.
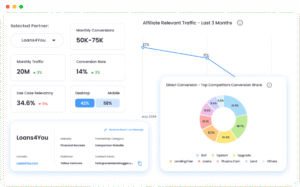
Partners Are Driving More Clicks Than Ever Before
What was really positive, was that the number of consumers being driven partners has significantly increased. Over some weeks, clicks increased by more than 100% YoY. This helps show the validity of this channel and why it remained one of the most resilient acquisition channels over the course of the past 12 months. 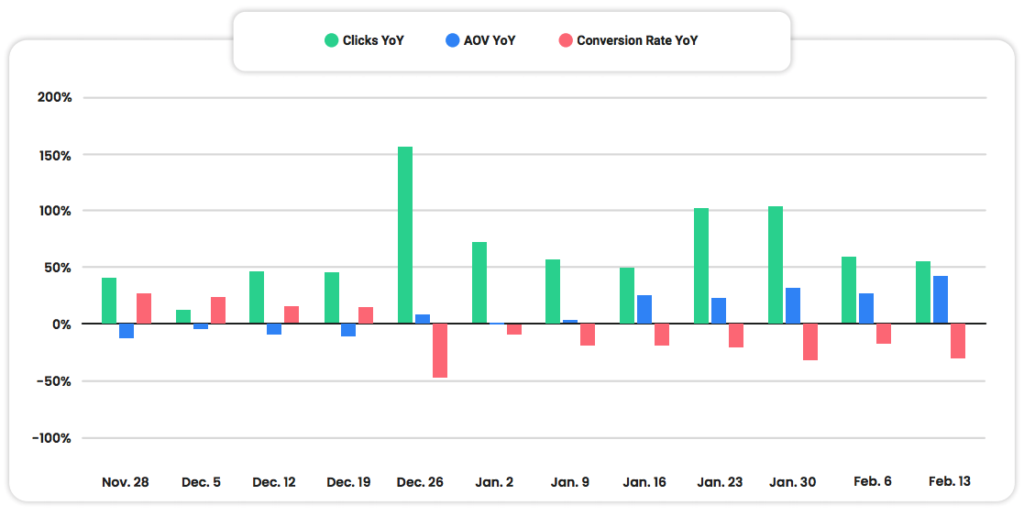
Average Order Value is Inconsistent
As expected, average order value (AOV) can significantly differ depending on the shopping period. Pre-Christmas, the AOV was slightly lower YoY – possibly because APAC shoppers were more budget conscious and were spending less on gifts. However, post-Christmas the AOV significantly increased YoY – some weeks 42% higher. This could indicate that marketers strategically using sale periods to drive higher value orders, are the ones coming out on top.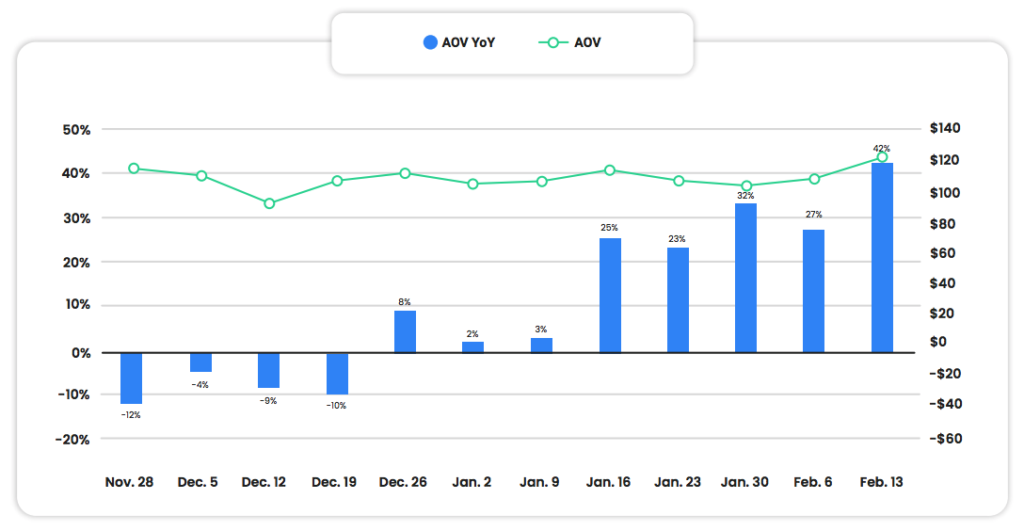
To learn more key partnership insights on revenue, commissions, conversion attributes, customer behavior and more, download our full Partnership Growth Index™ here.